Turbulent Boundary Layer
 gif, 102KB
Copyright(C)1980 Y. IRITANI, N. KASAGI and M. HIRATA, All rights reserved.
Turbulent Boundary Layer
 gif, 190KB
Copyright(C)1980 Y. IRITANI, N. KASAGI and M. HIRATA, All rights reserved.
Impinging Jet
 gif, 513KB
Copyright(C)1978 S. YOKOBORI, N. KASAGI and M. HIRATA, All rights reserved.
Axi-Symmetric Jet
 gif, 258KB
Copyright(C)1983 J. KURIMA, N. KASAGI and M. HIRATA, All rights reserved.
FCFC Surface
 gif, 153KB
Copyright(C)1983 M. IKEYAMA, N. KASAGI and M. HIRATA, All rights reserved.
Quasi-coherent structures in numerically simulated turbulentchannel flow
 gif,93KB
Low pressure regions (white, p'+<-3.0) in the lower half of thecomputational volume (mesh spacings in the streamwise directionand spanwise direction,100 wall units; mesh spacings in the wall-normaldirection, 50 wall units)
Refernece: Kasagi, N., and Ohtsubo, Y., 1994, Turbulent ShearFlows VIII, 97, Springer-Verlag, Berlin.
Copyright(C)1992 N. KASAGI and Y. OHTSUBO, All rights reserved.
 gif,93KB
Pressure and velocity vectors in the plane perpendicular to theflow (red, low pressure region; blue, high pressure region; mesh spacings, 50 wall units)
Copyright(C)1992 N. KASAGI and Y. OHTSUBO, All rights reserved.
 gif,275KB
Ejections (yellow, u'<0, v'>0, and u'+v'+<-3) and sweeps(green, u'>0, v'<0, and u'+v'+<-3) accompanied by vorticalstructures (white, p'+<-3)
Copyright(C)1992 N. KASAGI and Y. OHTSUBO, All rights reserved.
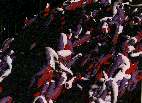 gif,407KB
High-rated production regions of Reynolds stress (red, P12<-0.2)and high velocity pressure gradient correlation regions (purple,f12>0.3) accompanied by vortical structures (white, p'+<-3)
Copyright(C)1992 N. KASAGI and Y. OHTSUBO, All rights reserved.
 gif,145KB
Low and high temperature regions (blue, T'+<-1.0; red, T'+>1.0) and velocity vectors in the x-z plane (1600*600 wall units) at Pr=0.71
Copyright(C)1992 N. KASAGI and Y. OHTSUBO, All rights reserved.
 gif,144KB
Low and high temperature regions (blue, T'+<-0.03; red, T'+>0.03) and velocity vectors in the x-z plane at Pr=0.025
Copyright(C)1992 N. KASAGI and Y. OHTSUBO, All rights reserved.
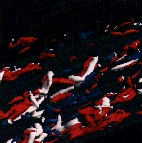 gif,164KB
High turbulent heat flux regions and low pressure regions (Pr=0.025)(red, n'+T'+(Q1)>0.23; blue, n'+T'+(Q3)>0.23; white, p'+<-3.0)
Copyright(C)1992 N. KASAGI and Y. OHTSUBO, All rights reserved.
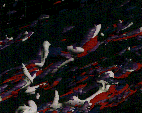 gif,302KB
Production and destruction regions of the wall-normal turbulentheat flux at Pr=0.71 (red, production>0.2; blue, dissipation>0.08;purple, temperature pressure gradient correlation<-0.3; white,low pressure region, p'+<-3.0)
Copyright(C)1992 N. KASAGI and Y. OHTSUBO, All rights reserved.
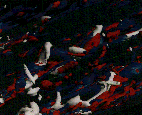 gif,290KB
Production and destruction regions of the wall-normal turbulentheat flux at Pr=0.025 (red, production>0.2; blue, dissipation>0.08;white, low pressure region, p'+<-3.0)
Copyright(C)1992 N. KASAGI and Y. OHTSUBO, All rights reserved.
Instantaneous 3-D velocity vectors over the riblet surfacemeasured with the 3-D PTV
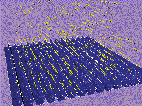 gif, 189KB
Copyright(C)1994 Y. SUZUKI and N. KASAGI, All rights reserved.
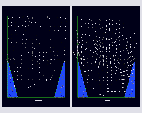
Turbulence flow measurements over a riblet surface with theaid of 3-D PTV
 gif, 38KB
Mean velocity vectors over the riblet surface in the cross-streamplane: LHS; Drag reducing condition, RHS; Drag increasing condition.Reference vectors at the bottom of figures denote 0.5% of themaximum velocity.
Refernece: Suzuki, Y., and Kasagi, N., 1994, AIAA J., 32, 1781.
Copyright(C)1994 Y. SUZUKI and N. KASAGI, All rights reserved.
Turbulent air flow measurement with the aid of 3-D PTV in acurved square duct
 gif, 44KB
Turbulent air flow in an 180 degree bend of square sectioned ductwas measured with the aid of 3-D PTV. The Reynolds number andthe Dean number were 17400 and 6720, respectively. He-filled soupbubble, of which specific density were very close to that of air,was employed as a flow tracer. The figure shows mean velocityvectors in the cross-stream plane of the bottom half of the ductat 90 deg . The right and left end respectively corresponds tothe inner and outer wall, and the flow goes out of the screen.Reference vectors at the bottom of figure denotes10% of the bulkmean velocity. The present results are generally in accordancewith the LDV data of Chang et al. (1983).
Refernece: Ijichi, M., Suzuki, Y., Sato, K., and Kasagi, N.,1994, JSME Reprints, No. 940-53, (in Japanese).
Copyright(C)1994 Y. SUZUKI and N. KASAGI, All rights reserved.
Simultaneous Measurement of Three-Dimensional Object Motion/Deformationand Circumambient Fluid Flow
Reference: Sata, Y. and Kasagi, N., Flow Visualization VII,J. P. Crowder, Ed., Proc. 7th Int. Symp. Flow Visualization, Seattle,Sept. 1995, Begell House, New York, pp. 721-726.
Copyright(C)1995 Y. SATA and N. KASAGI, All rights reserved.
3-D Channel Flow
![]() QT, 3.3MB
QT, 3.3MB
The time evolution of the flow field in thechannel from t+ = 0 to 129.6 is shown in Figure. The white andblue contour surfaces in the sequence of top (x-z) views respectivelyrepresent the low-pressure and low-speed regions, i.e., vorticalstructures and wall-layer streaks. The meandering of the streak,which is known to be one of the major phases in the regenerationmechanism of the streamwise vortices (Hamilton et al., 1995),is seen at t+ = 57.6 and later.
Reference: Satake, S. and Kasagi, N., 1995. Proc 10th Turbulenceshear flows, Penn. State, pp. 11-1-11-6.
Copyright(C)1996 S. SATAKE and N. KASAGI, All rights reserved.
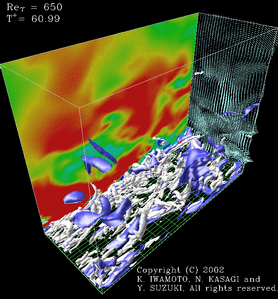
3-D Turbulent Channel Flow at Re_tau = 650
 GIF, 13MB
The time evolution of the turbulent flow field in the plane channel at Re_tau = 650 from t+ = 0 to 61 is shown. The white and blue iso-surfaces in the sequence represent the vortical structures (the second invariant of the deformation tensor Q+ = -0.05) and the low-speed regions (u'+ = -3), respectively. We use the convective frame of observation (Uc+ = 16) that provides the best visualization of the vortical structures. The color contour on the side slice plane represents instantaneous streamwise velocity fluctuations (blue to red, -2 to 2), while the vectors on the cross-stream plane are the instantaneous velocity components in that plane.
Reference: Iwamoto, K., Suzuki, Y., and Kasagi, N., 2002. "Reynolds Number Effect on Wall Turbulence: Toward Effective Feedback Control," Int. J. Heat and Fluid Flow, Vol. 23, pp. 678-689.
Copyright(C) 2002 K. IWAMOTO, N. KASAGI and Y. SUZUKI, All rights reserved.
Turbulent Flow over a Wavy Wall
a)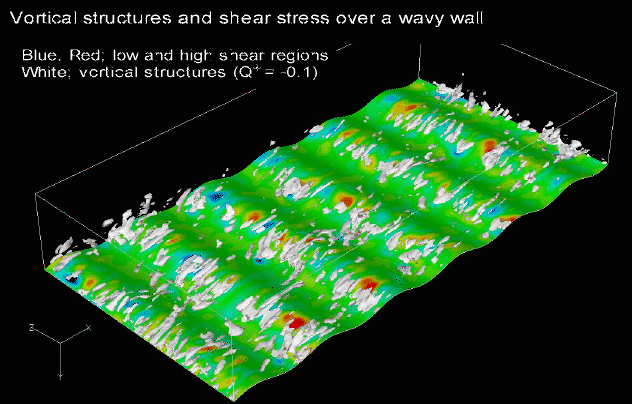 GIF, 5MB
|
b)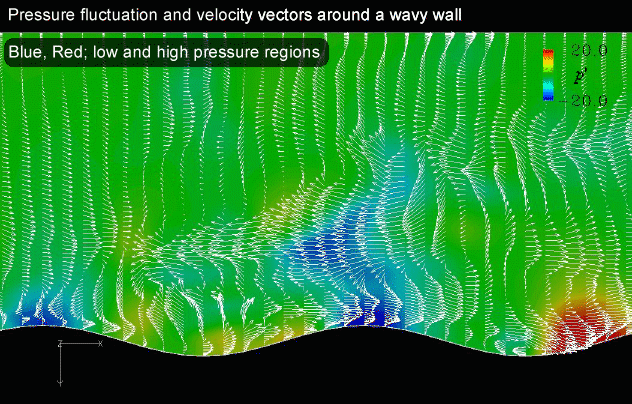 GIF, 8MB
|
Copyright(C) 2003 Y. HASEGAWA and N. KASAGI. All rights reserved.
 QT, 7.8MB